
Market depth can show whether a seemingly attractive trade has room to move or whether one sizeable order could shift the price. It is the live view of buyers, sellers and quantities waiting at different price levels, helping traders assess liquidity and potential execution risk.
This guide explains what market depth is and why it matters. It covers how bids, offers, spreads, order sizes, cancellations and executions shape the order book, then shows how to use market depth for trading. It also examines slippage, support and resistance, hidden liquidity, misleading orders and feed limitations.
What Is Market Depth, and Why Does It Matter?

A quoted price represents only the best available buying and selling interest. Market depth shows the orders positioned beyond those top quotes, allowing traders to assess how much demand and supply exists at several price levels. In other words, what is market depth? It is the quantity of pending buy and sell orders waiting in an asset’s order book, together with the prices at which those orders may execute.
Depth of Market: Orders Waiting at Each Price
Depth of market, often shortened to DOM, is the electronic order book displayed as a price ladder. The bid side records buyers and the prices they are prepared to pay. The ask side, also called the offer side, records sellers and the prices they require. Orders are grouped by price, so traders can see where available size is concentrated.
For instance, a simplified book might show buy orders of 15 lots at 1.0852, 30 lots at 1.0851 and 60 lots at 1.0850. On the other side, sell orders might stand at 1.0853, 1.0854 and 1.0855. The highest bid and lowest ask sit closest to the current market. Orders positioned further away form the remaining depth.
The order book may appear as a scrolling ladder or as a depth chart. A ladder lists the price, order quantity and, on some platforms, the number of orders at each level. A depth chart presents cumulative buying and selling quantities visually. A tall accumulation of orders indicates more displayed liquidity at those prices, whereas small quantities across a few levels indicate a thin book.
The book changes whenever a trader submits, executes, modifies or cancels an order. Consequently, market depth is a live view rather than a fixed measure. Data usually comes from the broker or another market-data provider, so the displayed book and a chart can differ slightly when various sources are used. Some platforms tend to hold the price range in a static position, meaning the trader may need to centre the display on the current price to see the nearest orders.
Why does this matter? A deep market can absorb a comparatively large order across nearby price levels with less price movement. A shallow market has less available quantity, so one sizeable marketable order can remove the nearest quotes and push execution towards worse prices. This connection makes market depth useful when assessing liquidity, likely slippage and the immediate effect of an order.
Market Depth vs Trading Volume: Available Liquidity vs Completed Trades
Market depth and trading volume describe different stages of market activity. Depth shows what is available now: limit orders waiting to buy or sell. Volume shows what has already happened: transactions completed during a chosen period. A heavily traded asset may therefore have high historical volume while displaying limited depth at the moment a trader checks the book.
The distinction answers two separate questions:
- Volume: How much has exchanged hands?
- Market depth: How much can be traded at nearby prices before the available orders are exhausted?
A buy order that is smaller than the quantity available at the best ask can normally execute without removing that price level. If the order exceeds the best ask quantity, it consumes that liquidity and continues to the next ask. Research on limit-order markets finds that price impact becomes more pronounced when a transaction exceeds the available depth at the best level.
Depth therefore provides a forward-looking execution reference, while volume supplies a record of completed activity. Neither measure works as a guaranteed forecast. Orders can disappear, new orders can arrive and the visible book may not show every source of liquidity. Even so, comparing intended order size with displayed depth gives traders a practical basis for deciding how to use market depth for trading.
How to Read a Market Depth Table
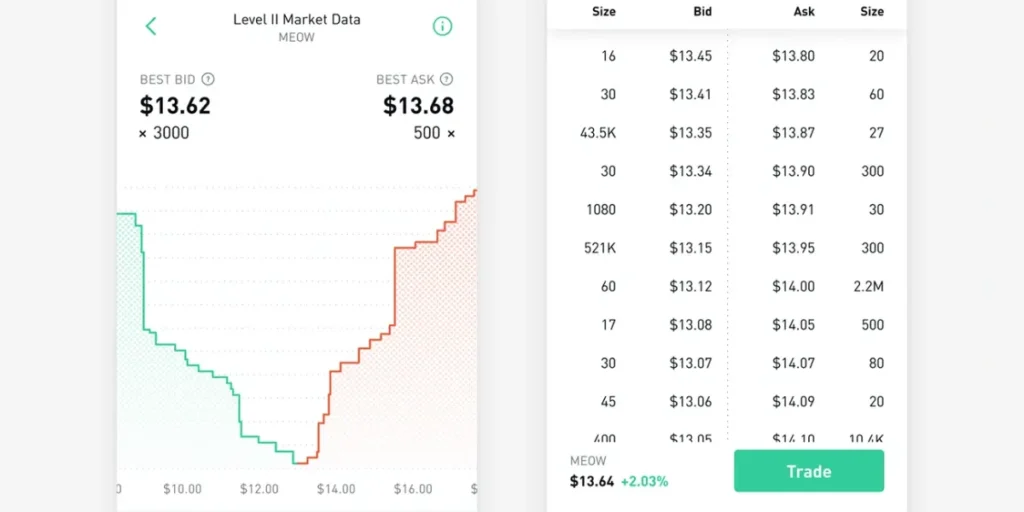
Reading a market depth table requires attention to both sides of the price ladder and the quantities attached to each level. A table normally lists buy orders opposite sell orders, allowing the trader to compare available interest at successive prices. Because entries update continuously, the displayed quantities describe the book at that moment, not completed trading activity.
Bid and Ask Prices: How Each Side Is Sorted
The bid side contains buy orders, while the ask side contains sell orders. On the bid side, prices run from highest to lowest, placing the strongest immediately available buying price at the top. On the ask side, prices run from lowest to highest, so the cheapest available selling price appears first. This arrangement lets a trader read away from the centre: lower bids and higher asks sit progressively farther from the current market. Each row may combine several orders submitted at the same price, with the displayed quantity representing their total size.
Best Bid, Best Ask and the Bid–Ask Spread
The top of the book consists of the highest bid and lowest ask. These are the best bid and best ask, respectively. The best bid is the highest price a buyer currently offers; the best ask is the lowest price a seller currently accepts. The gap between them is the bid–ask spread, calculated as ask price minus bid price. A trader buying at the market normally meets the ask, whereas a trader selling meets the bid. Consequently, the spread represents an indirect trading cost. A narrow spread generally signals more liquidity; a wide spread can indicate lower liquidity or greater volatility.
To read the table efficiently, the trader can identify the nearest bid and ask first, then inspect how much size stands behind them.
Order Counts and Quantities at Each Price Level
Quantity and order count answer different questions. Quantity shows the total asset amount available at a price level, whereas order count shows how many separate orders contribute to that total. At the same price, execution follows price–time priority: earlier orders are filled before later orders. Therefore, an order count does not by itself prove stronger liquidity, because the quantities may differ greatly. Traders should compare total size with intended trade size and inspect adjacent levels rather than focus on one row. That comparison shows how far an order may travel before available liquidity ends.
How Orders Change the Order Book
A market depth display responds to each order entering or leaving the book. A resting limit order remains available at its specified price until it executes, is amended or cancelled. For a buy, it sets the highest acceptable purchase price; for a sell, it sets the lowest acceptable sale price. When the order cannot trade immediately, it waits in the queue and adds displayed liquidity at that level.
Resting Limit Orders Add Displayed Liquidity
Orders at prices away from the best quote can remain visible without execution. Their presence shows potential supply or demand, but it does not guarantee a fill. Price and time priority governs execution: orders at a better price go first, whereas orders at the same price are ranked by submission time. Therefore, a later order can join a sizeable queue yet still wait behind earlier orders. If a platform aggregates levels, the displayed total hides that queue structure.
Marketable Orders Consume Available Bids and Offers
A marketable order is able to trade against a quoted level immediately. A buy takes available offers, starting with the lowest ask, whereas a sell takes available bids, beginning with the highest bid. If its size exceeds the quantity at that first level, the matching process continues through successive prices. Consequently, one order can remove several rows and produce an average execution price worse than the first displayed quote. The order book then records lower remaining quantity or a missing level.
This is why traders comparing order size with nearby depth can estimate likely slippage before choosing how to use market depth for trading. A market order seeks speed and accepts available prices, whereas a limit order controls the maximum buy price or minimum sell price. In thin conditions, even a marketable order may take longer to complete because tradable quantity is scarce.
Order Changes and Cancellations Alter Depth and Queue Position
Amending or cancelling a resting order changes the quantity shown at its price. A reduction can shrink displayed depth, while a new submission can add to it. A modification may also affect priority: moving to another price can place the order behind existing orders there. Cancellation data alone does not show whether size disappeared from the front or back of a queue, particularly when the feed reports aggregate quantities. For that reason, queue position estimates from level data remain approximate. Traders should compare falling displayed size with executions, because reduction may reflect fills, cancellations or both. Cancellations can occur behind the trader and may not improve queue position.
How to Use Market Depth for Trading
A practical use of market depth starts with execution rather than prediction. Compare intended size with nearby liquidity, test visible interest against executions, and match the order type to execution risk.
Compare Order Size with Available Depth to Estimate Slippage
Start with the best bid and ask, then quantities across levels until the planned size is covered. A buy larger than the first ask consumes further offers; a sell consumes bids. Estimate the weighted average fill and compare it with the midpoint. For a buy, impact cost equals (average execution price minus midpoint) divided by midpoint, multiplied by 100.
Identify Potential Support and Resistance from Order Clusters
Large clusters of bids may mark potential support, while concentrated offers may indicate potential resistance. They show displayed interest, not guaranteed buying or selling. A cluster can vanish through cancellations or be absorbed by marketable orders. Compare it with executions: repeated buying at a bid supports relevance, whereas untouched size provides weaker evidence. Depth charts and heat maps show concentration, not commitment.
Choose Between Market and Limit Orders Based on Execution Risk
Market orders favour speed but accept prices and may walk through thin levels. Limit orders cap the maximum buy or minimum sell price; they control price risk but may remain unfilled. Use limits or split size in a thin book. A round trip pays the spread on entry and exit. For options, inspect depth at the exact strike because open interest does not show a live bid.
What Displayed Market Depth Cannot Tell You

Hidden and Iceberg Orders Leave Some Liquidity Unseen
Displayed quantities exclude hidden and iceberg orders. An iceberg exposes a portion while retaining size out of view. Repeated replenishment after executions may indicate concealed interest. Dark pools and alternative venues can hold activity absent from the displayed book. Consequently, thin levels may conceal liquidity.
Spoofing and Pulled Orders Can Mislead Traders
Large orders may not represent genuine execution intent. Spoofing places orders to suggest demand or supply, then cancels them; layering distributes orders across price levels. A trader learning how to use market depth should compare displayed size with prints. If a level repeatedly disappears as price approaches without trades there, support or resistance weakens. Cancellation alone does not prove manipulation, because traders amend quotes as conditions change.
Feed Delays and Exchange Coverage Limit the View
Timing and coverage also limit the view. In fast markets, the book can change dozens of times per second, leaving viewers with incomplete information. A SIP feed may show top-of-book data across venues, not full L2 depth, and may omit odd-lot quotes. Therefore, exchange-specific coverage and feed type determine what market depth a trader sees.
Conclusion – Market Depth
Market depth gives traders a live view of displayed buying and selling interest across multiple price levels. The order book helps them compare intended size with available liquidity, estimate slippage, assess spreads and identify possible support or resistance. It also clarifies how limit orders, marketable orders, executions and cancellations continually reshape available depth. Visible imbalances and large clusters can be useful signals, although they are not guarantees. Hidden liquidity, spoofing, changing queues and incomplete feeds can make the picture unreliable. Overall, traders should treat depth as an execution tool rather than a standalone prediction method, using it alongside price action, completed trades and disciplined risk management.
You May Also Be Interested In: Fintech Explained: How Technology Is Reshaping Money, Banking, and Payments
What does market depth tell a trader?
Market depth shows pending buy and sell orders at different prices. It helps traders assess available liquidity and how much their order could move the execution price.
How is market depth different from trading volume?
Market depth shows orders waiting to trade, while trading volume records completed trades over a period. High trading volume does not necessarily mean there is plenty of liquidity available now.
How do you read a market depth table?
Start with the highest bid and lowest ask; the difference is the bid–ask spread. Then check the quantities at nearby price levels to see whether they can accommodate your intended trade size.
How can market depth help reduce slippage?
Compare your order size with the quantities available across nearby prices. If liquidity is thin, reducing or splitting the order may help. A limit order controls your acceptable price, but it may not fill.
Can large orders in the order book reliably predict price movements?
No. Large buy or sell orders may suggest potential support or resistance, but they can be cancelled or absorbed. Check completed trades and price action rather than relying on displayed orders alone.