
Crypto market cycles follow predictable patterns that repeat every four years on average, yet most investors recognise these phases only after they’ve already happened. Understanding crypto market cycles involves identifying four distinct phases: accumulation, markup, distribution, and markdown. Key drivers of the crypto cycle include Bitcoin’s halving events, which occur roughly every four years, along with market correlation and macroeconomic factors. This guide explains crypto market cycles in detail, equipping investors with strategies to navigate crypto bear market cycles and capitalise on opportunities across each phase.
What Is a Crypto Market Cycle?

A crypto market cycle represents repeating patterns of price movements driven by investor behaviour, market sentiment, and macroeconomic trends. These cycles consist of alternating periods between low activity and undervaluation, followed by strong growth, overvaluation, and eventual correction. Each complete cycle typically spans three to four years, though the timing varies depending on adoption rates, regulatory developments, and economic factors.
Related Article: The Bitcoin 4-Year Cycle Explained: A Strategic Guide for 2026
How Crypto Cycles Differ from Traditional Markets
Crypto cycles operate at an accelerated pace compared to traditional financial markets. Traditional assets, such as equities or real estate, can take years to rise and fall fully, whereas cryptocurrency can do so in months. This speed stems from several factors: 24/7 trading without market closures, global access with minimal barriers to entry, and fewer regulatory constraints. Cryptocurrencies’ decentralised structure, continuous trading hours, and minimal regulation amplify emotional reactions and accelerate information flow.
Price sensitivity to news, hype, and emotion creates more extreme swings. A single tweet, security breach, or policy change can shift momentum instantly. Hence, whilst the cycle pattern mirrors traditional markets, crypto cycles exhibit greater volatility, offering bigger opportunities alongside substantially higher risk.
Why Understanding Crypto Market Cycles Matters for Investors
Recognising cycle phases helps investors determine when risk is lower or higher and when to enter, hold, or reduce exposure. This knowledge is especially useful given that Bitcoin’s price has moved in four-year periods since 2011, with bull market peaks in November 2013, December 2017, and November 2021. Similarly, bear market bottoms occurred in January 2015, December 2018, and November 2022.
Understanding cycles enables investors to avoid common timing mistakes. For instance, if someone bought Bitcoin during the 2018-2021 bull market and planned to sell exactly four years from its previous bull market top, they would not have sold until the price had already dropped over 30% from its current bull market high. In effect, cycles serve as one of many reference points rather than a precise framework for specific strategies.
The distinction between rational and irrational sentiment during different phases helps investors manage timing and risk. This becomes critical when emotions drive decision-making, as price rises trigger excitement, greed, and FOMO, whilst declines create fear, panic, and capitulation.
The Psychology Behind Crypto Market Cycles
Emotional triggers such as fear and greed drive volatility throughout crypto market cycles. Research reveals that herding behaviour, prospect theory, and heuristic theory significantly affect investors’ decisions in the cryptocurrency market. Irrational investors heavily rely on market sentiment due to fundamental uncertainties, leading to speculative bubbles.
Behavioural finance offers a framework for recognising how biases, emotions, and social influence shape decisions under uncertainty. Markets move in cycles because emotions arrive first, with greed, fear, and hope driving movements more than logic. During bull runs, optimism transforms into euphoria, whilst crashes flip sentiment to panic and despair. Prices tend to swing beyond fair value in both directions due to this emotional behaviour.
Social influence and public sentiment particularly drive herding behaviour in the crypto market. Investors exhibit patterns where their choice of cryptocurrencies depends on others’ decisions, demonstrating that traditional finance theory proves insufficient for understanding cryptocurrency market dynamics.
The Four Phases of Crypto Market Cycles Explained
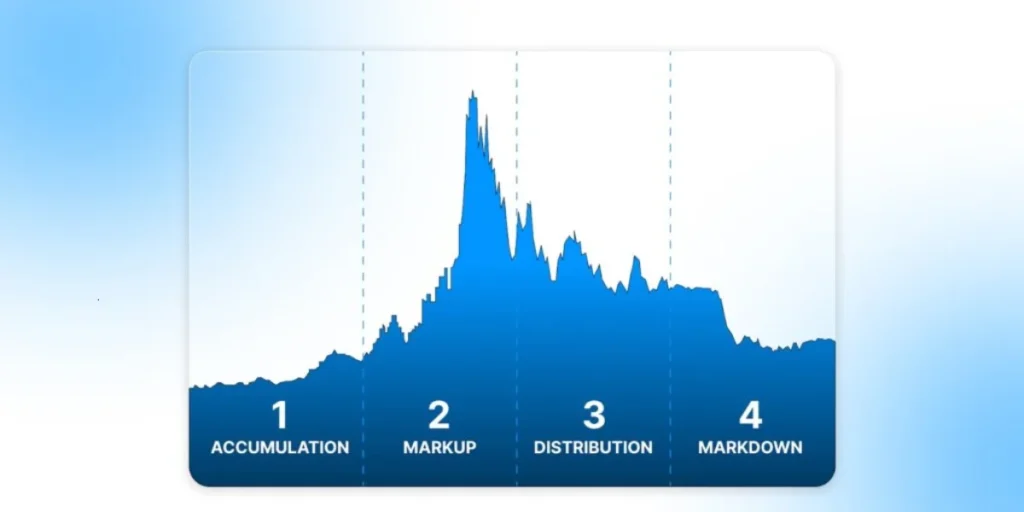
Market participants navigate through four sequential phases that form complete crypto market cycles, each exhibiting distinct price patterns and trading behaviours.
Phase 1: Accumulation (Building Positions at Low Prices)
The accumulation phase commences once the bulk of sellers exit the crypto market. Prices stabilise after a bear market, with low volatility and low trading volume characterising this period. During this phase, volatility tends to be prevalent initially, but as accumulation unfolds, prices typically stabilise. Forward-thinking buyers accumulate cheaper bitcoin as it represents the point of maximal upside. Prices fluctuate in a tight range near the bottom, whilst bearish sentiment keeps volume low. Smart money and institutional investors quietly build positions, recognising oversold conditions through low RSI indicators. Extreme fear dominates the market, with retail investors hesitant to re-enter, allowing institutions to capitalise on these conditions and set the stage for the next bull run.
Phase 2: Markup (Bull Market Growth)
In Bitcoin’s growth phase, price continues moving towards the all-time high. Past halving events have occurred here, coinciding with shrinking exchange reserves as buyers absorb supply in anticipation of rising prices and new all-time highs. Prices break out of consolidation, and Bitcoin dominance rises, signalling investor confidence. The Fear & Greed Index shifts toward Greed, whilst prices consistently make higher highs and lows. Trading activity and volume increase substantially as institutional buying and media coverage attract retail traders, leading to a bull market. Optimism returns, and FOMO begins to take hold as retail investors enter the market, with mainstream media coverage driving more retail attention.
Phase 3: Distribution (Market Peak and Profit-Taking)
During the bubble phase of the bitcoin market cycle, the price eclipses the previous all-time high and begins to move exponentially to the upside. These higher prices typically exceed the previous highs by a significant amount. The bitcoin bubble phase is extremely volatile, characterised by rapid price increases followed by significant corrections. Sell volume builds as a portion of investors lock in healthy profits, whilst many market participants continue to buy, believing the bull market has more room to run.
Correspondingly, price volatility is low, as buy and sell volumes begin to balance against a backdrop of overconfidence. At this point, the Fear & Greed Index typically flashes Extreme Greed. Smart money and institutional investors sell their holdings and distribute their assets without sending the price too much down.
Phase 4: Markdown (Bear Market Decline)
Following the euphoria of the bubble phase, the market experiences a major correction to the downside. Previous bear market periods have resulted in approximately 80% drawdowns from the top and negative price action for approximately a year. The most recent example saw the price tumble by almost 78% from an all-time high of USAUD 105500.33 in November 2021 to USAUD 23662.65 in November 2022. Panic selling and capitulation characterise this phase, with supply outweighing demand as the market outlook becomes increasingly negative. Many people choose to hold on to their investments, even if the value has decreased below what they paid for them.
Bitcoin Halving and Its Impact on Crypto Cycles
Bitcoin’s protocol implements a deflationary mechanism through halving events, which reduce mining rewards by approximately 50% every four years. This built-in feature controls inflation whilst maintaining scarcity, directly influencing crypto market cycles and price dynamics.
What Happens During a Bitcoin Halving Event
A halving event occurs after every 210,000 blocks mined, cutting the block reward miners receive in half. When Bitcoin launched in 2009, miners earned 50 BTC per block. This dropped to 25 BTC, then 12.5 BTC, and currently stands at 3.125 BTC. The mechanism reduces new Bitcoin issuance from approximately 900 coins daily to roughly 450 coins per day. This supply reduction continues until all 21 million Bitcoin have been mined, expected around 2140.
The halving does not affect existing Bitcoin balances in wallets. Instead, it only reduces rewards for adding new blocks to the blockchain. Miners face decreased profitability unless Bitcoin’s price rises to offset the reward cut. Some may stop mining if costs such as electricity and hardware exceed potential earnings. However, the network automatically adjusts mining difficulty to maintain a steady block production rate of approximately one block every ten minutes.
Historical Halving Patterns and Price Movements
The first halving occurred on 28 November 2012, reducing rewards from 50 BTC to 25 BTC. Bitcoin traded at approximately AUD 18.35 during this event, subsequently reaching AUD 1528.99 by November 2013. The second halving occurred on July 9, 2016, when rewards were reduced to 12.5 BTC. Bitcoin was trading at about AUD 993.84 during the event, climbing to nearly AUD 30579.80 by December 2017.
On 11 May 2020, the third halving reduced rewards to 6.25 BTC. Bitcoin’s price surged from around AUD 10550.03 a month before to about AUD 13455.11 at the event itself, eventually reaching over AUD 91739.41 in March 2021. The most recent halving happened on 20 April 2024 at block height 840,000, reducing rewards to 3.125 BTC. Bitcoin was trading at approximately AUD 97855.37 during this event. The next halving is expected mid-2028 when blocks reach 1,050,000, dropping rewards to 1.5625 BTC.
How Halving Triggers Bull Markets
Historically, Bitcoin enters significant bull runs within 12 to 18 months following each halving. The 2012 halving led to a 9,520% rise over 365 days, whilst the 2016 halving saw a 3,402% increase over 518 days. The 2020 halving produced a 652% rise over 335 days. The mean average time before prices peak after a halving is around 406 days.
Supply shock drives this upward pressure. With fewer new coins entering circulation and steady or growing demand, basic economics favours price appreciation. Media attention amplifies this effect, attracting retail and institutional capital. Following the 2020 halving, popular cryptocurrencies including as Ethereum, Cardano, and Solana had significant gains. In less than a year, the whole crypto market capitalization grew from roughly AUD 275.22 billion to more than AUD 3.06 trillion, with the top 30 digital assets jointly increasing by 308%.
Post-Halving Accumulation Strategies
Dollar-cost averaging proves particularly effective during halving cycles. By investing fixed sums at regular intervals, investors accumulate more Bitcoin during corrections and less during peaks, hence stabilising average entry prices. This approach has consistently outperformed market timing over complete four-year cycles.
Buy and hold strategies fully capture Bitcoin’s long-term trajectory. Purchasing at the halving and holding for four years has historically always been profitable. Momentum strategies excel during post-halving expansion phases by positioning in the direction of dominant trends, enabling exits before major corrections. Timing strategies such as buying six months before halving and selling 18 months after aim to exploit cyclical behaviour, though these require a thorough understanding of market phases.
Key Indicators That Signal Cycle Phase Changes
Recognising when crypto market cycles shift between phases requires monitoring specific indicators that reflect market sentiment, capital flows, and participant behaviour.
Fear and Greed Index as a Sentiment Measure
The Fear and Greed Index quantifies market emotion on a scale from 0 to 100, where readings between 0 and 24 indicate extreme fear, whilst values from 75 to 100 signal extreme greed. The CMC Fear and Greed Index calculates this score using five weighted components: price momentum of top 10 cryptocurrencies by market capitalisation (excluding stablecoins), volatility through Volmex Implied Volatility Indices for Bitcoin and Ethereum, derivatives market Put/Call ratios, market composition via the Stablecoin Supply Ratio, and proprietary social trend data. Extreme fear often represents oversold conditions and potential buying opportunities, whereas extreme greed suggests overheated markets prone to correction.
Bitcoin Dominance and Market Correlation
Bitcoin dominance measures Bitcoin’s market capitalisation as a percentage of total crypto market value. Rising dominance typically signals capital flowing toward relative safety, whilst falling dominance indicates risk appetite spreading into altcoins. A sustained weekly close below 54% that holds for two consecutive weeks has preceded capital rotation from Bitcoin to alternatives historically. Correspondingly, dominance above 60% suggests Bitcoin season, whilst readings below 50% often coincide with altcoin strength building.
Trading Volume and Price Action Patterns
Trading volume confirms whether price movements carry genuine market conviction. High volume during price advances signals strong buying interest supporting upward momentum, whilst rising volume during declines indicates intensifying selling pressure. Conversely, price moves on weak volume often lack sustainability and may reverse quickly.
On-Chain Metrics for Tracking Whale Activity
Large cryptocurrency transactions exceeding AUD 1.53 million reveal whale positioning. Exchange inflows suggest potential selling pressure as holders move assets where they can liquidate quickly, whilst outflows indicate long-term holding intentions. The Accumulation Trend Score reaching 0.99 out of 1.0 signals aggressive whale accumulation despite surface-level selling narratives.
Strategies for Each Phase of the Crypto Cycle

Adapting investment approaches to match specific phases within crypto market cycles maximises returns whilst managing downside risk effectively.
Dollar-Cost Averaging During Accumulation
Research shows 59% of crypto investors use dollar-cost averaging as their primary investment strategy. This approach involves investing fixed amounts at regular intervals regardless of price, reducing emotional interference and helping traders stick to their strategies. Automated investment strategies outperform manual trading by 3.8% annually simply by removing emotional interference. During accumulation phases, DCA allows investors to acquire more units when prices are depressed, smoothing average entry costs over time.
Profit-Taking Rules for Distribution Phase
Establishing predefined trading rules maintains discipline during distribution phases. Pre-commitment devices reduce emotional decision-making by 67% when rules are established during calm, rational periods. Investors can implement laddered sell orders, exiting positions incrementally at different price points. Limit orders execute automatically at specific prices, locking in desired profits, whilst trailing stop-loss orders adjust as prices rise, protecting gains against downturns.
Using Stablecoins to Preserve Capital
Stablecoins function as neutral holding positions during market volatility, allowing investors to preserve capital without converting to fiat. They enable near-instantaneous transaction settlement and lower costs than traditional payment rails. Correspondingly, traders use stablecoins as base currency to rotate between volatile assets efficiently.
Avoiding Emotional Trading Decisions
Stop-loss orders and take-profit targets ensure traders stick to strategies, reducing impulsive actions during market swings. Studies show 80% of trading mistakes stem from emotions rather than technical flaws. Implementing cooling-off periods and pre-planned exits removes negotiation with oneself during volatile moments.
Conclusion – Crypto Market Cycles
Mastering crypto market cycles provides investors with a structured framework for navigating volatile digital asset markets. The four distinct phases—accumulation, markup, distribution, and markdown—follow predictable patterns influenced chiefly by Bitcoin halving events and investor psychology. By the same token, key indicators such as the Fear and Greed Index, Bitcoin dominance, and on-chain metrics enable traders to identify phase transitions with greater accuracy. Strategies like dollar-cost averaging during accumulation, disciplined profit-taking during distribution, and leveraging stablecoins for capital preservation help investors capture opportunities whilst managing risk. Ultimately, recognising these cyclical patterns transforms market volatility from a threat into a strategic advantage for informed participants.
What are the four phases of a crypto market cycle?
A crypto market cycle consists of four distinct phases: accumulation (when prices stabilise at low levels and smart investors build positions), markup (the bull market growth period with rising prices), distribution (market peak where profit-taking occurs), and markdown (the bear market decline with significant price corrections). Each complete cycle typically spans three to four years.
What happens during the accumulation phase?
The accumulation phase begins after a bear market when prices stabilise with low volatility and trading volume. During this period, forward-thinking investors and institutions quietly build positions at lower prices whilst extreme fear keeps retail investors hesitant to re-enter the market, creating opportunities for those recognising oversold conditions.
What strategies work best during different crypto cycle phases?
Dollar-cost averaging proves effective during accumulation by smoothing entry prices, whilst predefined profit-taking rules help maintain discipline during distribution phases. Using stablecoins preserves capital during volatility, and implementing stop-loss orders alongside cooling-off periods helps avoid emotional trading decisions that account for 80% of trading mistakes.