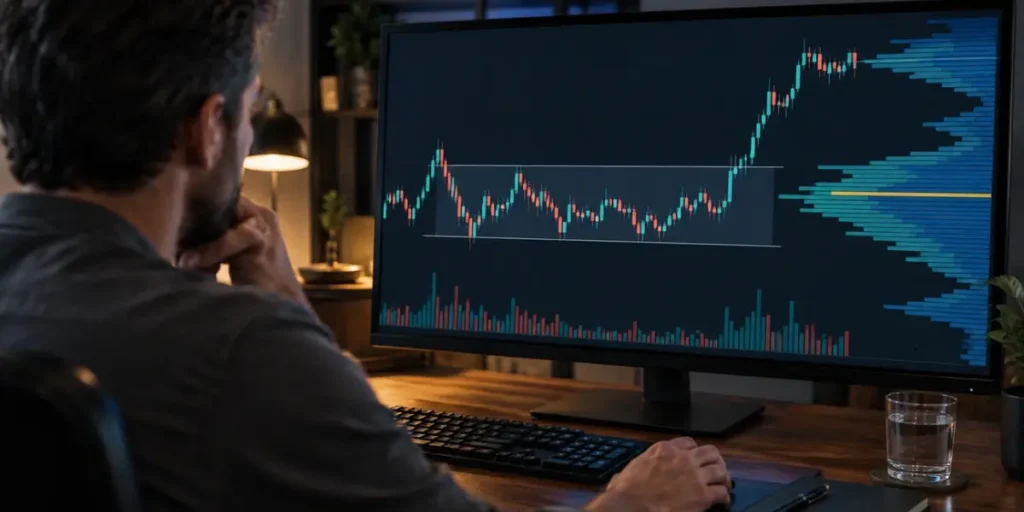
Volume profile can reveal where crypto traders accepted or rejected price, giving them a clearer view of potential support, resistance and fast-moving areas. Unlike volume by time, it maps trading activity by price, highlighting the Point of Control, Value Area and high and low volume nodes. The most common value area contains 70% of traded volume.
This guide introduces volume profile trading and explains how volume profile trading crypto setups develop around HVN retests, LVN breakouts and rotations between VAH and VAL. It also shows how traders can confirm entries with price action, place invalidation-based stops, manage leverage and position size, and backtest strategies after fees and slippage. Since the profile does not predict direction alone, confirmation and risk management remain essential.
What Volume Profile Shows on a Crypto Chart
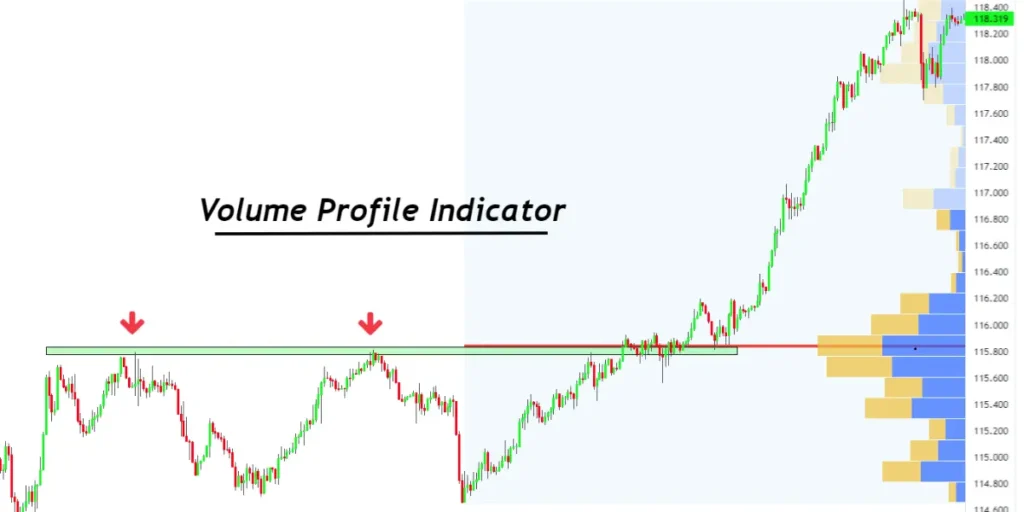
A crypto chart contains more information than the direction of each candle. The distribution of trading activity shows which prices attracted sustained participation and which prices saw little interest. Volume profile displays that distribution as a horizontal histogram beside the price axis. Longer rows represent greater traded volume within the selected period, while shorter rows represent less activity. It remains a historical record, so it identifies previously important prices rather than forecasting the next move.
Volume by Price vs Volume by Time
Standard volume bars group activity by time. Each candle receives one bar, which answers the question, “How much traded during this period?” Volume profile asks a different question: “At which prices did that volume trade?” This distinction helps traders separate a busy candle that consolidated around one level from a busy candle that moved rapidly across several levels.
The profile sums volume into price rows over a chosen window, such as a session, swing or visible chart range. The result depends on the selected period, row size and platform calculation. A coarse row size can merge nearby areas, whereas a finer setting can create several smaller peaks. Therefore, levels that remain visible across reasonable settings deserve more attention than isolated features produced by one configuration.
Crypto data also requires checking the volume source. Centralised exchanges and exchange-traded futures can provide executed trade volume. Some platforms, particularly for crypto CFDs, use tick volume, which counts price updates rather than completed transactions. Base or quote volume may also be supplied for crypto markets. The profile must be interpreted according to the data actually available.
Point of Control and Value Area Boundaries
The Point of Control (POC) is the price row with the highest traded volume in the selected profile. It marks the period’s most concentrated trading, but it does not guarantee support, resistance or a future reaction. Traders should treat it as a zone whose width reflects the profile’s row size, rather than as an exact prediction line.
The Value Area (VA) contains a selected share of total profile volume, commonly 70%. Its upper boundary is the Value Area High (VAH), and its lower boundary is the Value Area Low (VAL). The percentage is a convention and can be adjusted. A move beyond VAH or VAL does not prove acceptance. Price needs to sustain activity and build volume outside the boundary; otherwise, a return inside the prior value area indicates rejection.
High Volume Nodes and Low Volume Nodes
High Volume Nodes (HVNs) are broad peaks where substantial trading accumulated. They represent areas of prior acceptance, so price may slow, consolidate or rotate when it revisits them. An HVN can act as support or resistance, although its historical role changes when fresh trading establishes value elsewhere.
Low Volume Nodes (LVNs) are thin areas between heavier parts of a profile. They often form when price travels quickly and little two-sided trade develops at the intermediate levels. Price may reject an LVN or move rapidly through it towards another HVN. However, an LVN is not permanent support or resistance. If later sessions build significant volume there, the former thin area has become accepted value.
Volume Profile Trading Setups to Watch in Crypto

Volume profile trading becomes more practical when each node is treated as a conditional area rather than an automatic entry. The setup depends on location, market structure and the response after price reaches the level. In crypto, traders can frame three recurring volume profile trading crypto scenarios.
High Volume Node Retests at Support and Resistance
An HVN retest tests prior acceptance. In an uptrend, price returning to an HVN from above may find support; in a downtrend, an approach from below may meet resistance. A node can also sit inside a range, where repeated reactions support rotation rather than directional continuation. The historical profile supplies context, not a trade signal.
Wait for price action at the node: a rejection wick followed by a close away from the zone, a failed break, or a swing-structure change. A long entry needs the HVN to hold as support, while a short entry needs resistance to remain intact. Targets can sit at the next value boundary or node. If price accepts beyond the HVN and builds activity there, the retest thesis fails.
Low Volume Node Breakouts Towards the Next High Volume Node
An LVN breakout setup focuses on a thin zone between larger HVNs. When price enters the LVN with a decisive candle and aligned momentum, the market may travel quickly towards the next high volume node. Traders can enter on the break or wait for a pullback to the LVN edge, which may then act as support for a long or resistance for a short. A clear higher-timeframe structure gives the move context.
Stops belong beyond the structure that invalidates the breakout, not at an arbitrary distance inside ordinary noise. The next HVN offers a logical target because activity may slow there. If the LVN has already filled with fresh volume, its fast-travel premise weakens; similarly, a tiny wick without follow-through does not establish a breakout.
Value Area Rotations Between VAH and VAL
Value area rotations suit balanced conditions. When price trades inside value, buyers and sellers can rotate between VAL and VAH, with the POC or another HVN providing an intermediate reference. A long setup near VAL requires a rejection and a return towards the interior; a short setup near VAH requires the opposite response. Traders can take partial profit at the POC and retain a portion for the opposing boundary when the range remains intact. A clean break invalidates rotation quickly.
How to Confirm Setups and Manage Trade Risk
An apparent reaction at a node is not an entry by itself. Volume profile trading requires context, a marked horizontal level and a defined trigger. Balance can favour a fade; initiative flow favours a pullback after a break.
Confirm Entries with Price Action and Horizontal Levels
Mark the POC, VAH, VAL, HVN or LVN before price reaches it. Confirm the response with a close, rejection wick, failed auction or footprint evidence. Absorption shows effort without progress; initiative shows stacked imbalances and continuation beyond the level.
Place Stops Where the Setup Becomes Invalid
For a long, place the stop beyond the reaction low or support zone; for a short, place it above resistance. Add a defined buffer. Exit when price is accepted through the level, even before the stop. Set targets just before the next HVN or profile reference.
Size Positions for Stop Distance and Leverage Risk
Risk a fixed capital amount per trade. Divide it by the entry-to-stop distance plus estimated costs to calculate quantity. Leverage increases exposure, so reduce position size when the stop is wider or contract exposure grows.
Backtest Setups After Fees and Slippage
Test a fixed profile window using only levels available at the decision time. Record entry, stop, target, drawdown and net result after fees, slippage, funding and contract costs. Compare results with unseen data, because a win rate alone cannot establish reliability.
Conclusion – Volume Profile
Volume profile gives crypto traders a structured way to interpret where participation gathered, where price was rejected and where movement may accelerate. POC, value area boundaries, HVNs and LVNs become useful reference points when combined with market structure and price action. Yet no level guarantees a reaction. Accordingly, traders should define invalidation, control position size and test each setup after fees and slippage. Disciplined execution, rather than the profile alone, turns these observations into a repeatable process.
You May Also Be Interested In: Investing Guide 2026: How Markets Are Shaping the Year Ahead
What makes a crypto volume profile setup worth considering?
Look for a key profile level that aligns with market structure and a clear price reaction, such as a rejection or confirmed breakout. No setup guarantees success; backtest it after fees and slippage.
Which timeframe should I use for volume profile trading?
Choose a profile window that matches the trade you are assessing, such as a session, swing or visible chart range. Keep the window consistent when testing, as changing it can produce different levels.
How do the Point of Control and value area differ?
The Point of Control (POC) is the price row with the most traded volume. The value area commonly contains 70% of the profile’s total volume, with VAH marking its upper boundary and VAL its lower boundary.
Can volume profile work in both ranging and trending crypto markets?
Yes, but the setup differs. Balanced markets may offer rotations between value area boundaries, while trending markets may offer high-volume node retests or moves through low-volume areas towards the next high-volume node.
What should I use alongside volume profile to confirm entries?
Combine profile levels with market structure, horizontal support and resistance, and price action such as rejection wicks or failed breaks. Place stops where the setup becomes invalid and size the position according to the stop distance and trading costs.